
Turn the forecast into the labour plan, hour by hour.
Outlay Labour shows the heads each area needs through the day, sets them against the team on shift, and tells you who to move and how much agency to order for the rest.
A Libra Europe product
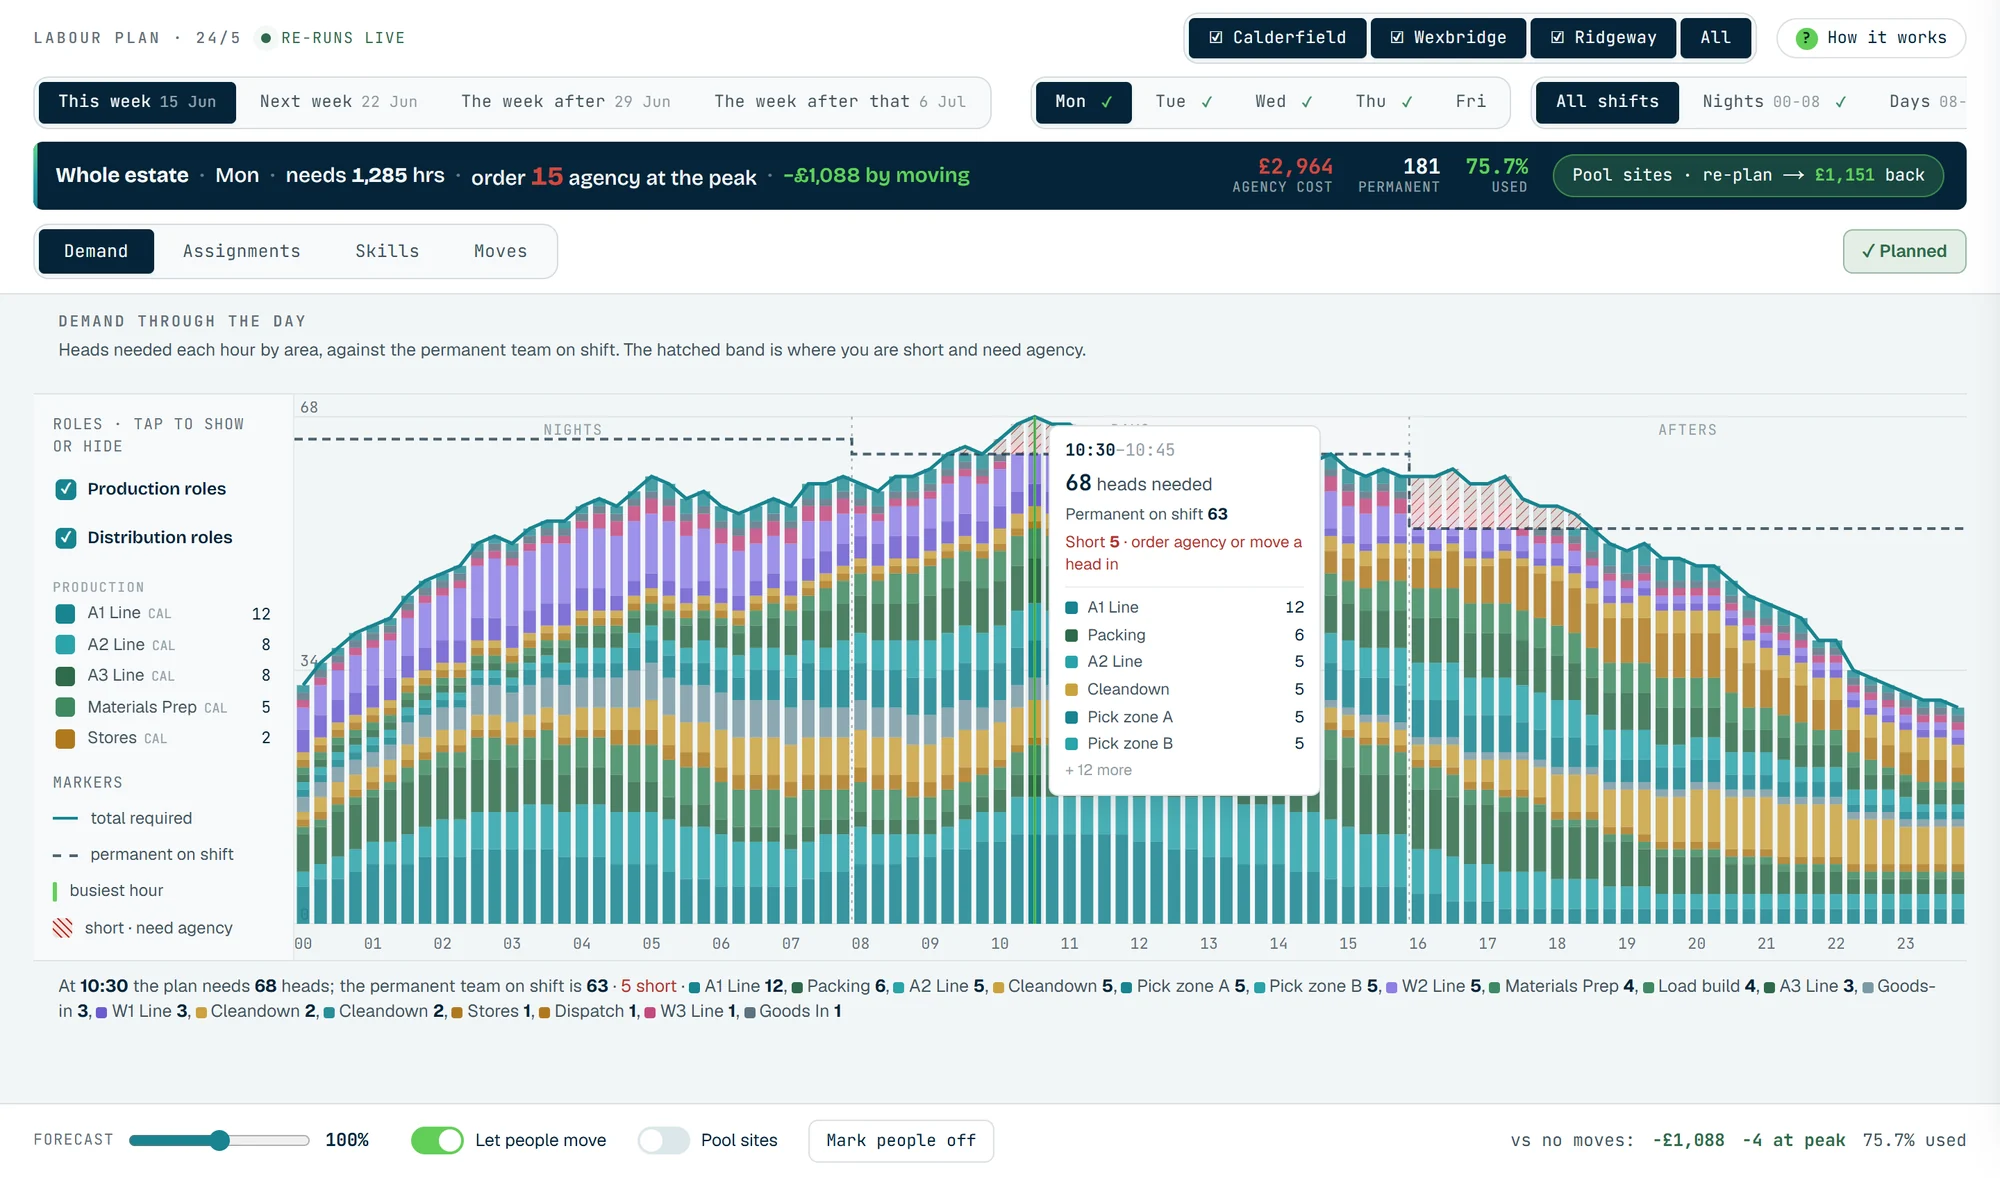
Every bar on the graph traces back to one line: volume × standard minutes ÷ 60 ÷ OEE.
One plant's day, heads by the quarter hour.
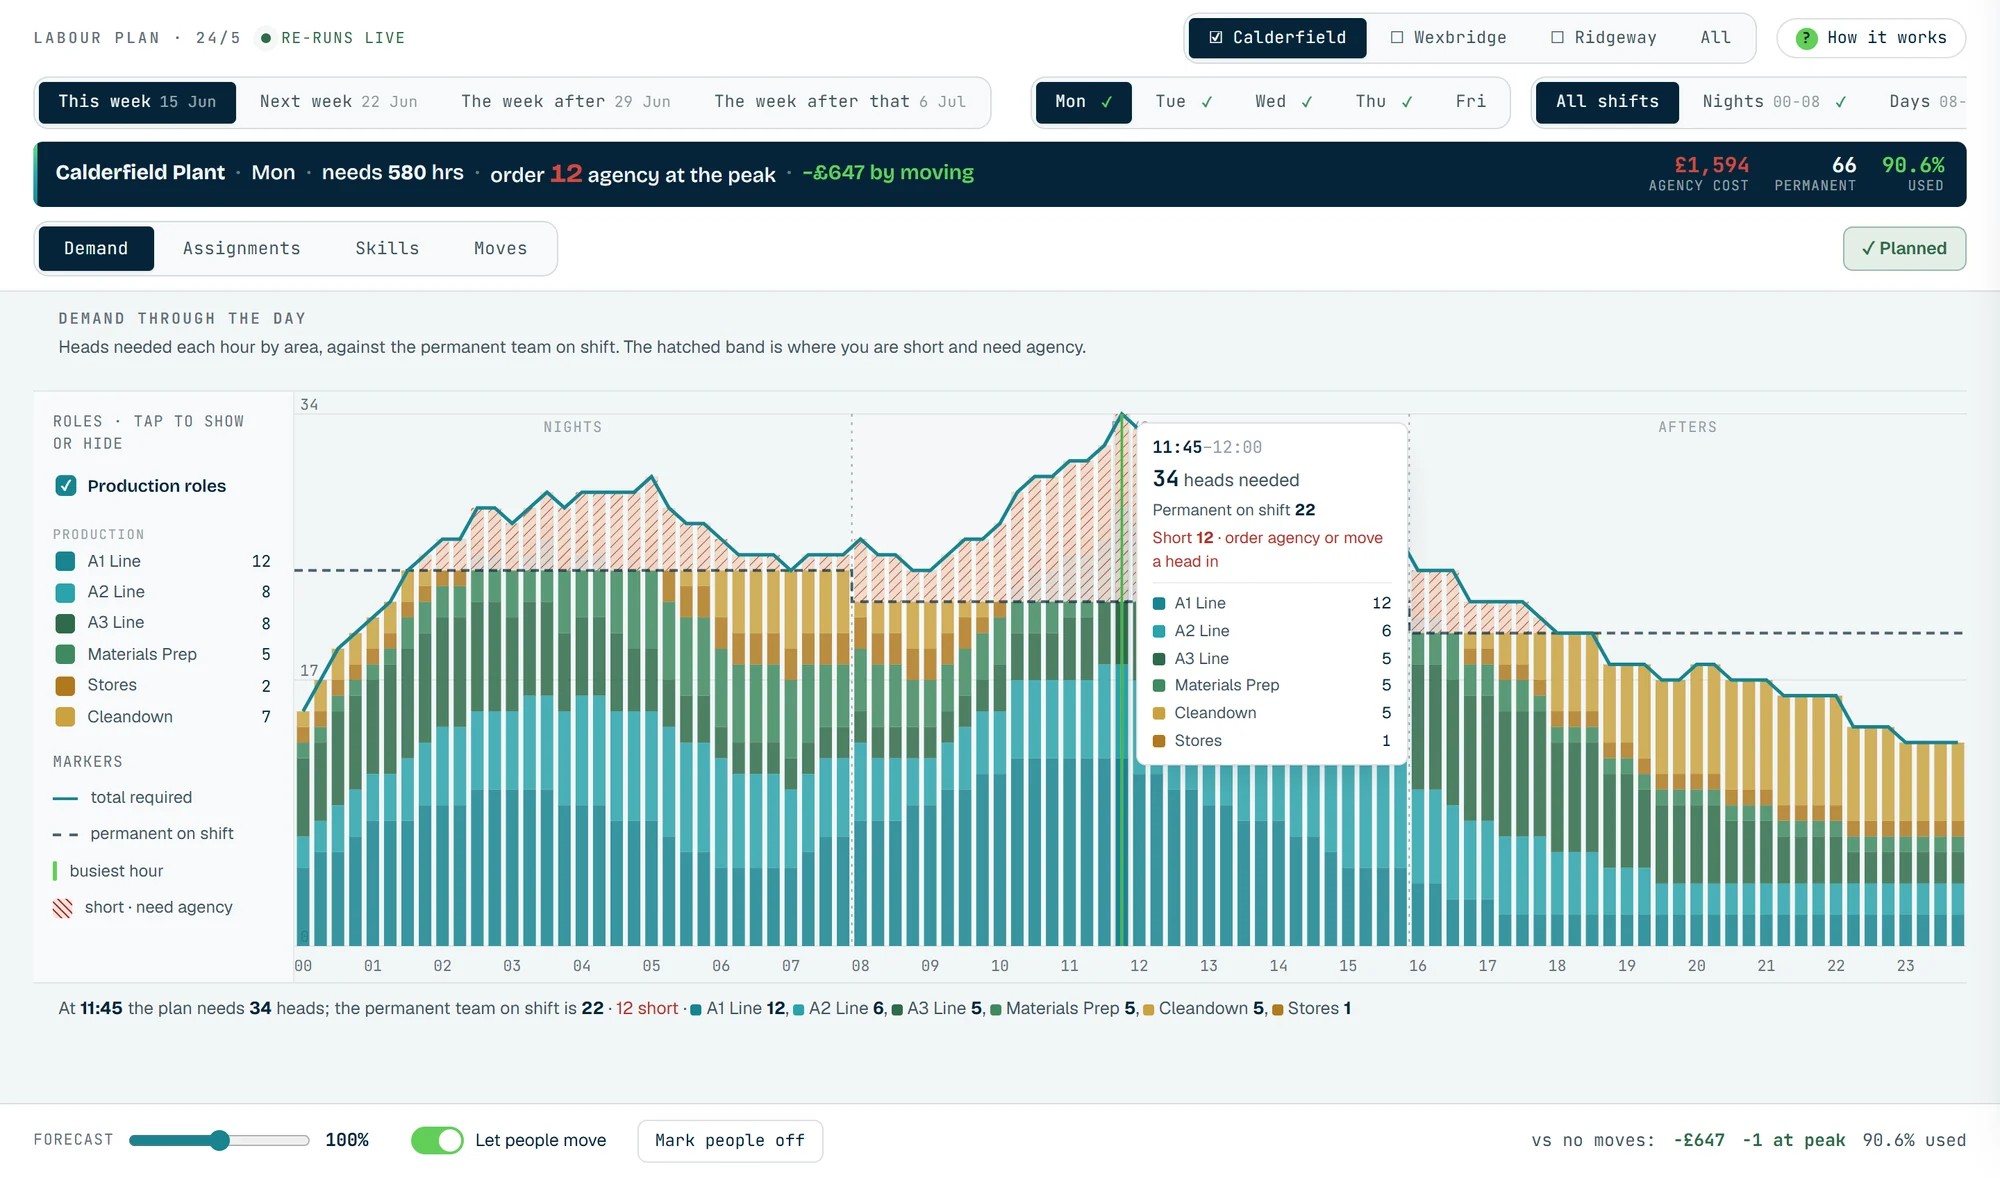
00:00 to 24:00
Forecast to hours.
Volume × standard minutes ÷ 60 ÷ OEE, for every task in every quarter hour.
From the week ahead down to who moves at half past midnight.
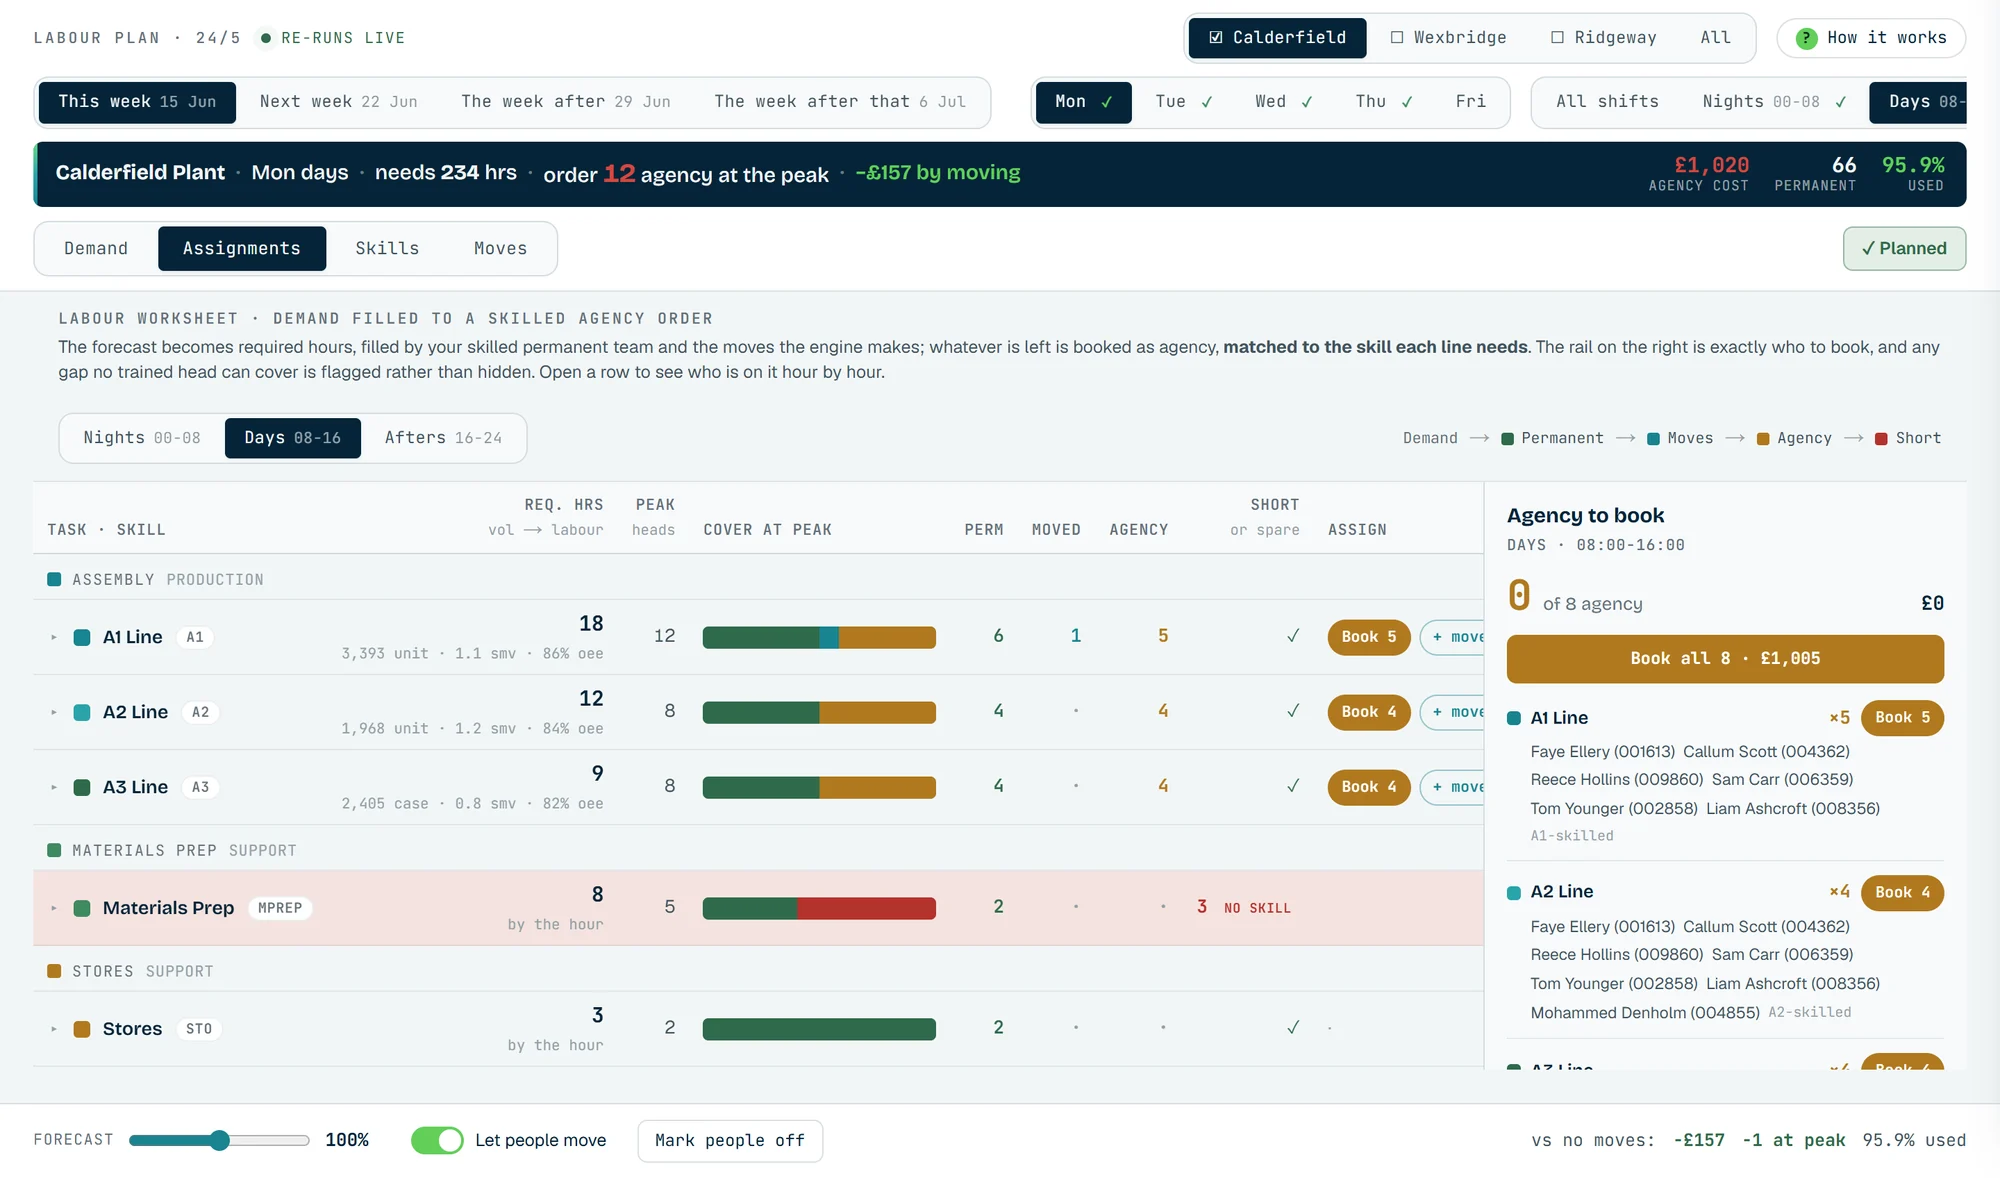
The agency order, line by line
Demand on each line is filled by the permanent team first, then by moves, and whatever is left becomes an agency booking matched to the skill that line needs.
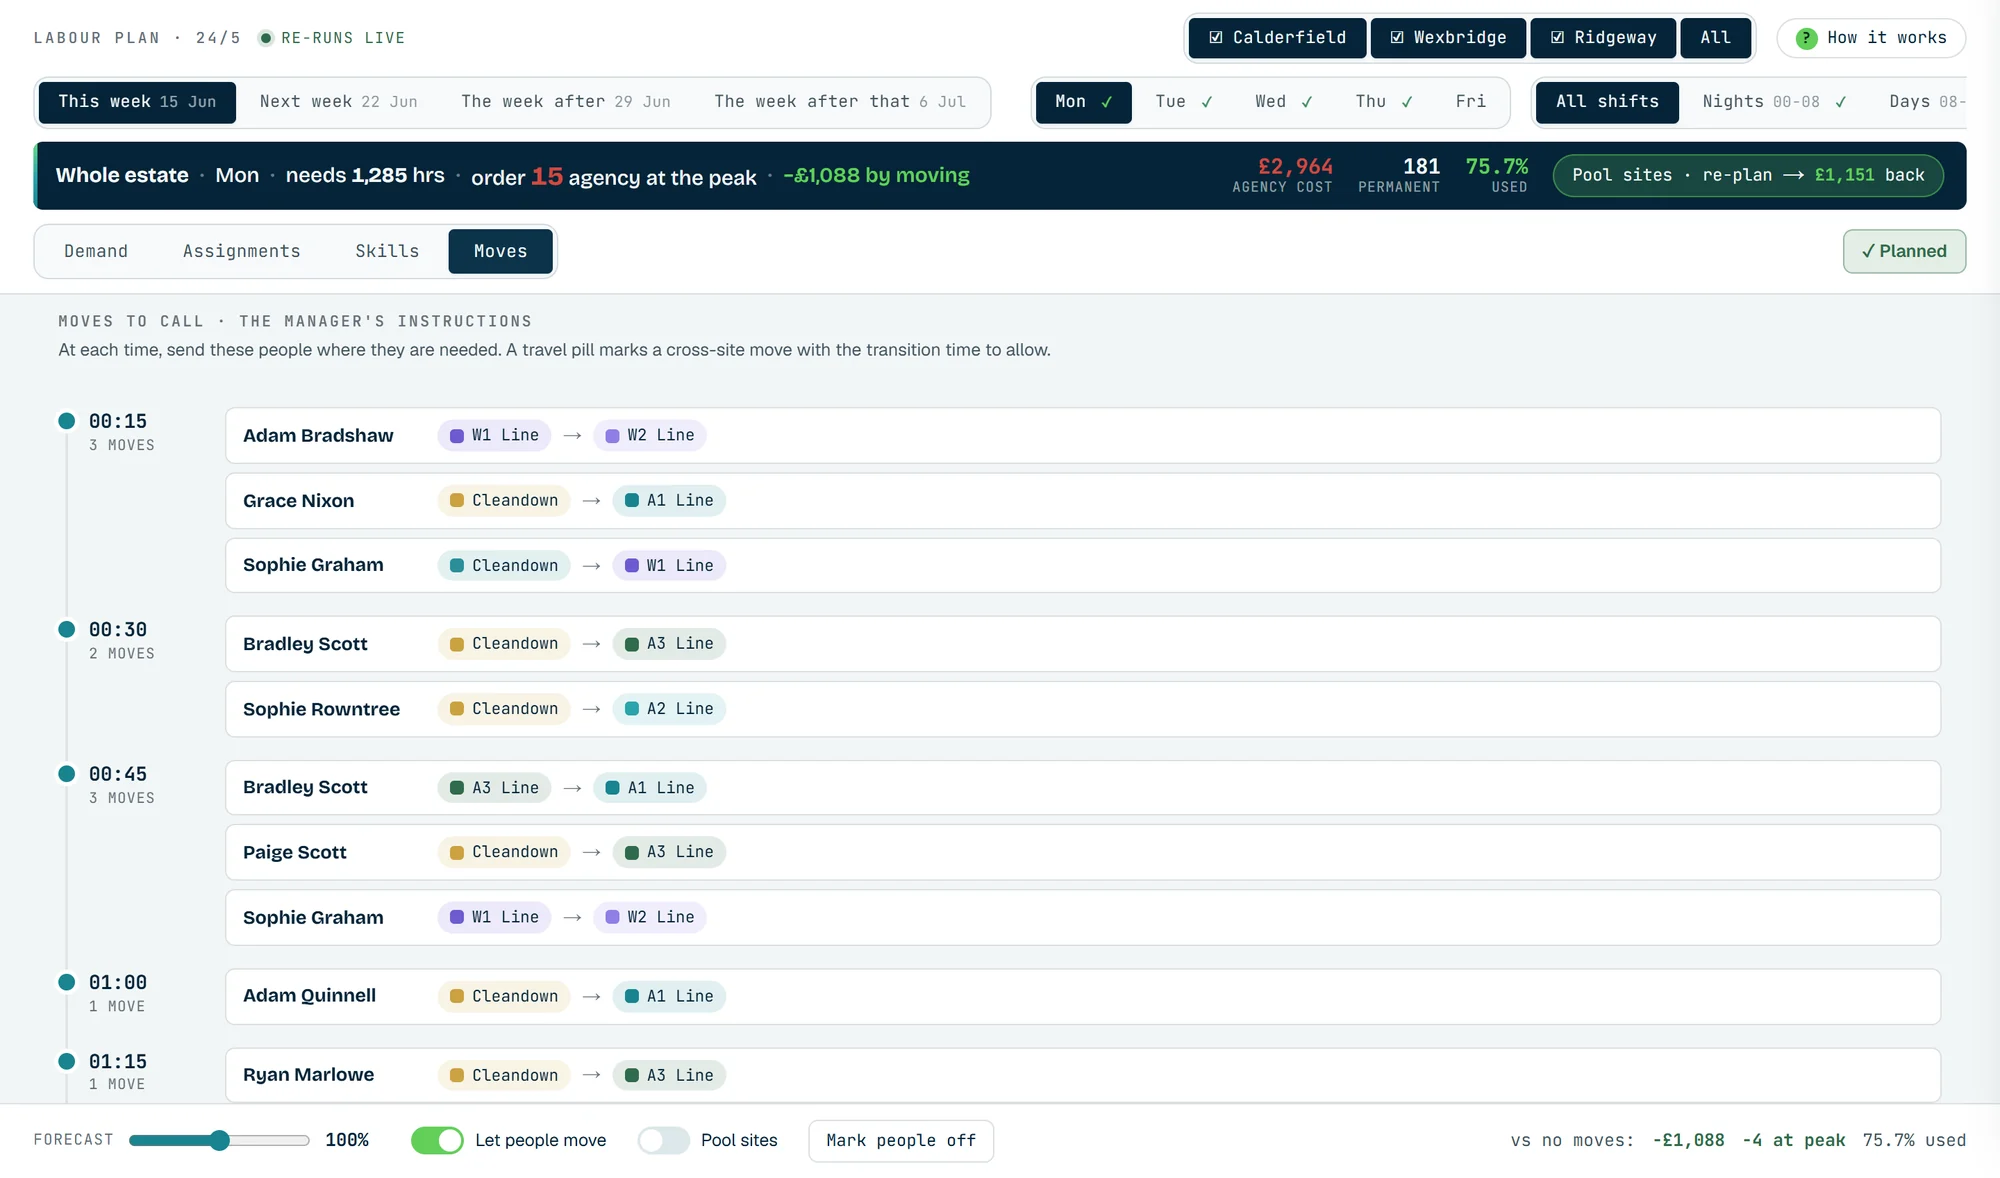
Moves to call, in time order
The supervisor's list for the shift: at each time, who goes from which line to which, with cross-site moves marked so the travel time is allowed for.
Who can run what
Each spoke is an area, filled to the share of the window's heads that are trained on it, permanent team first and agency on top, so a skills gap shows before it becomes an agency bill.
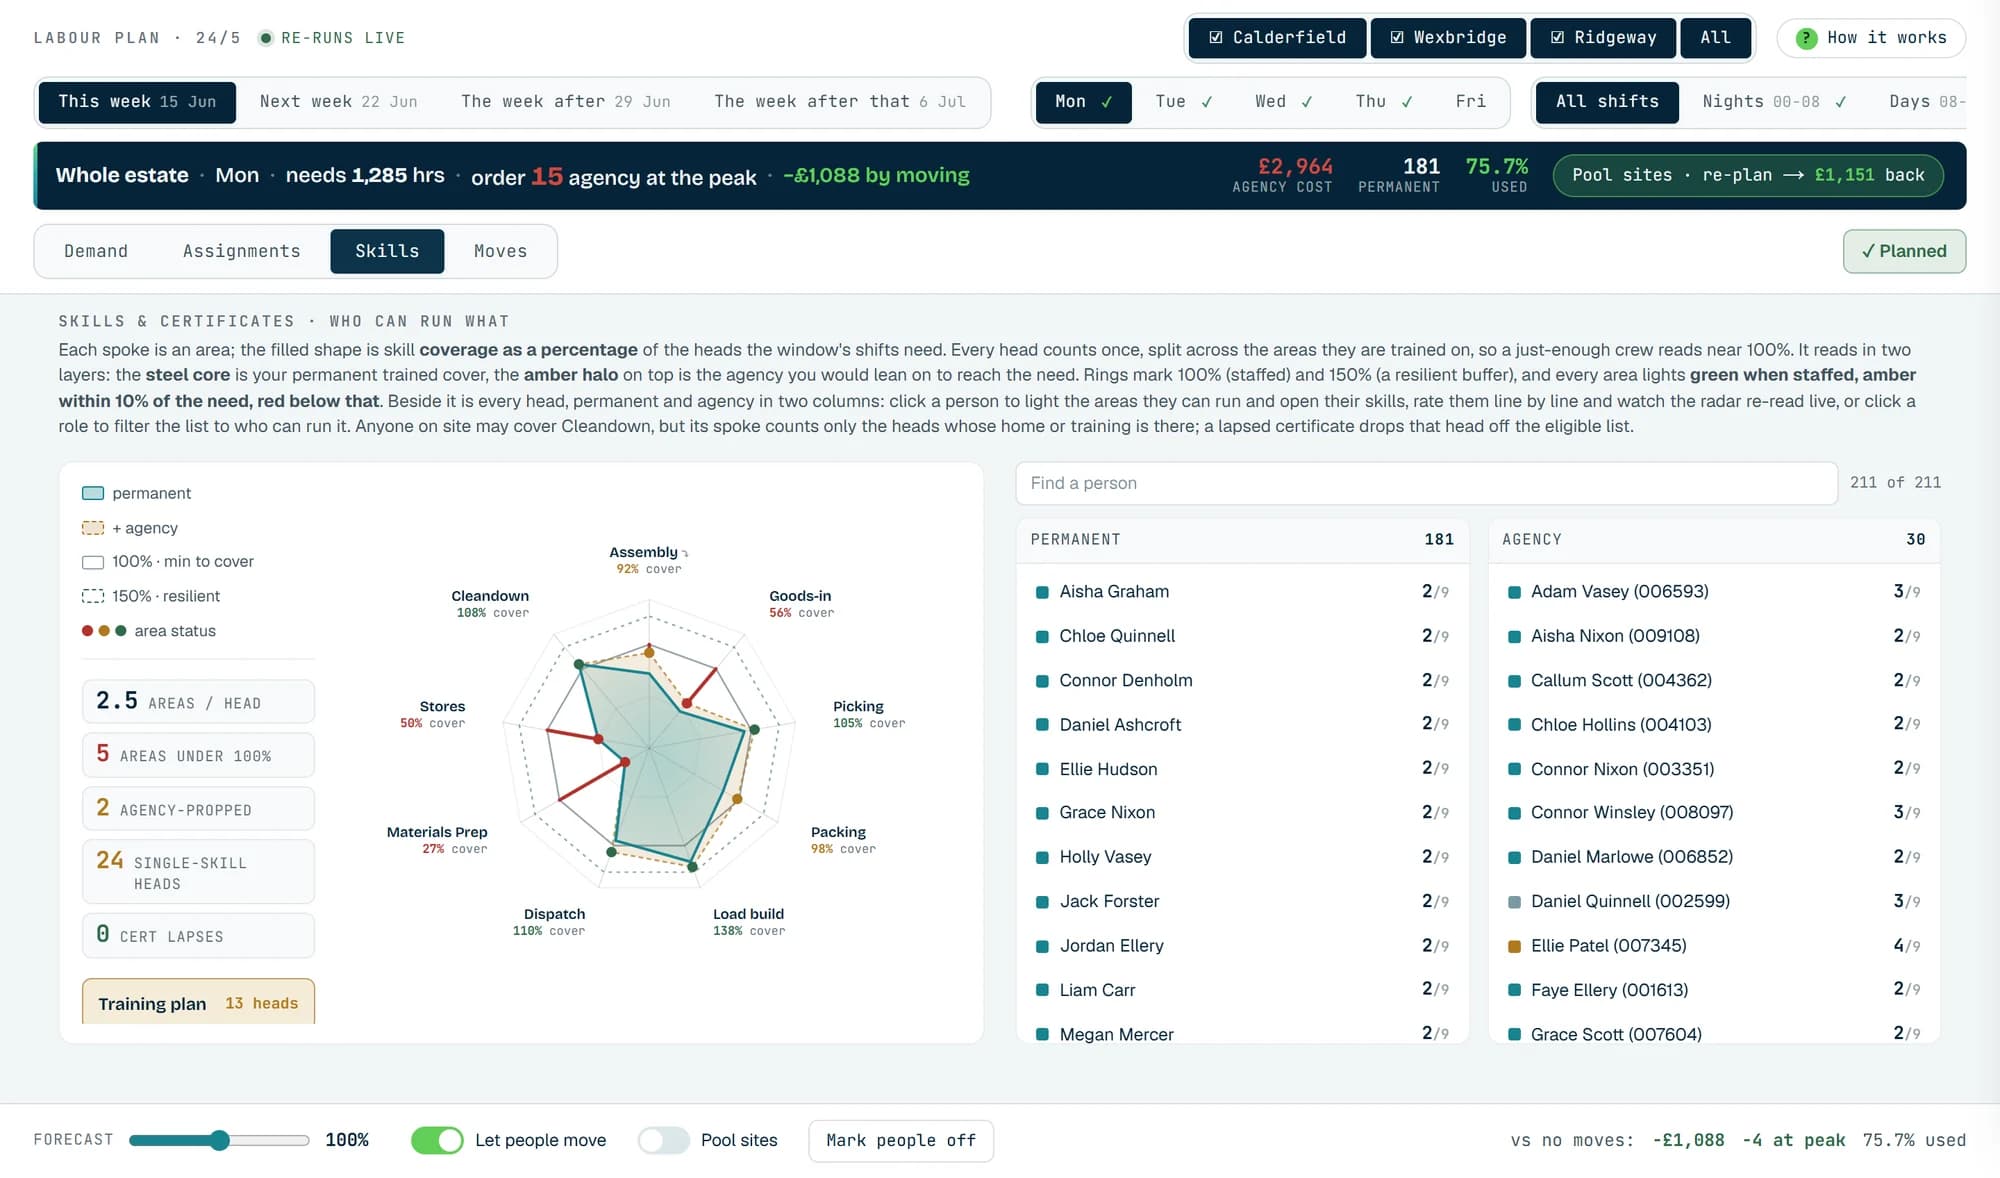
The week ahead, and the year behind it.
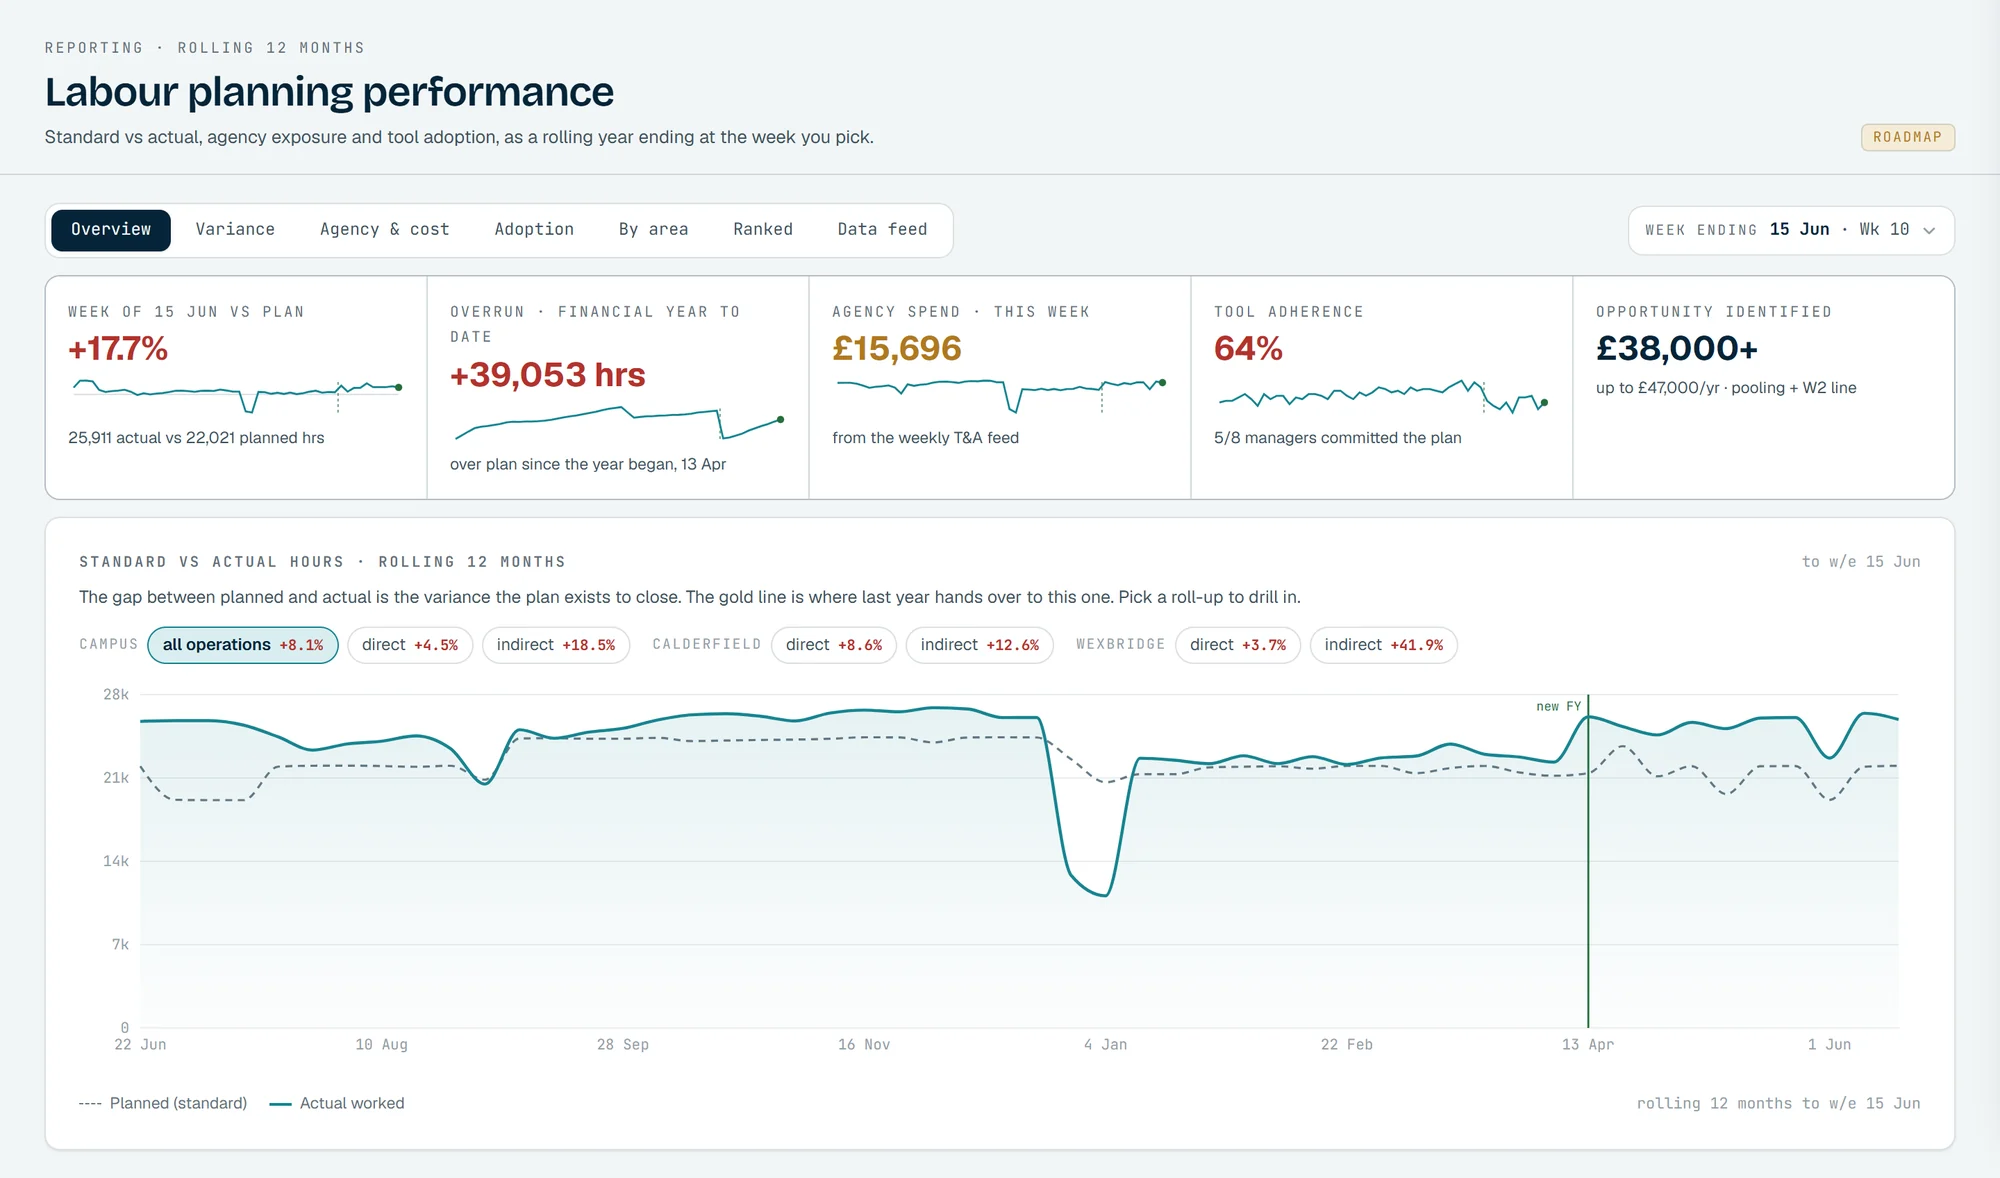
Reporting
Standard against actual hours, overrun, agency spend and how often managers follow the plan, by week and by area.
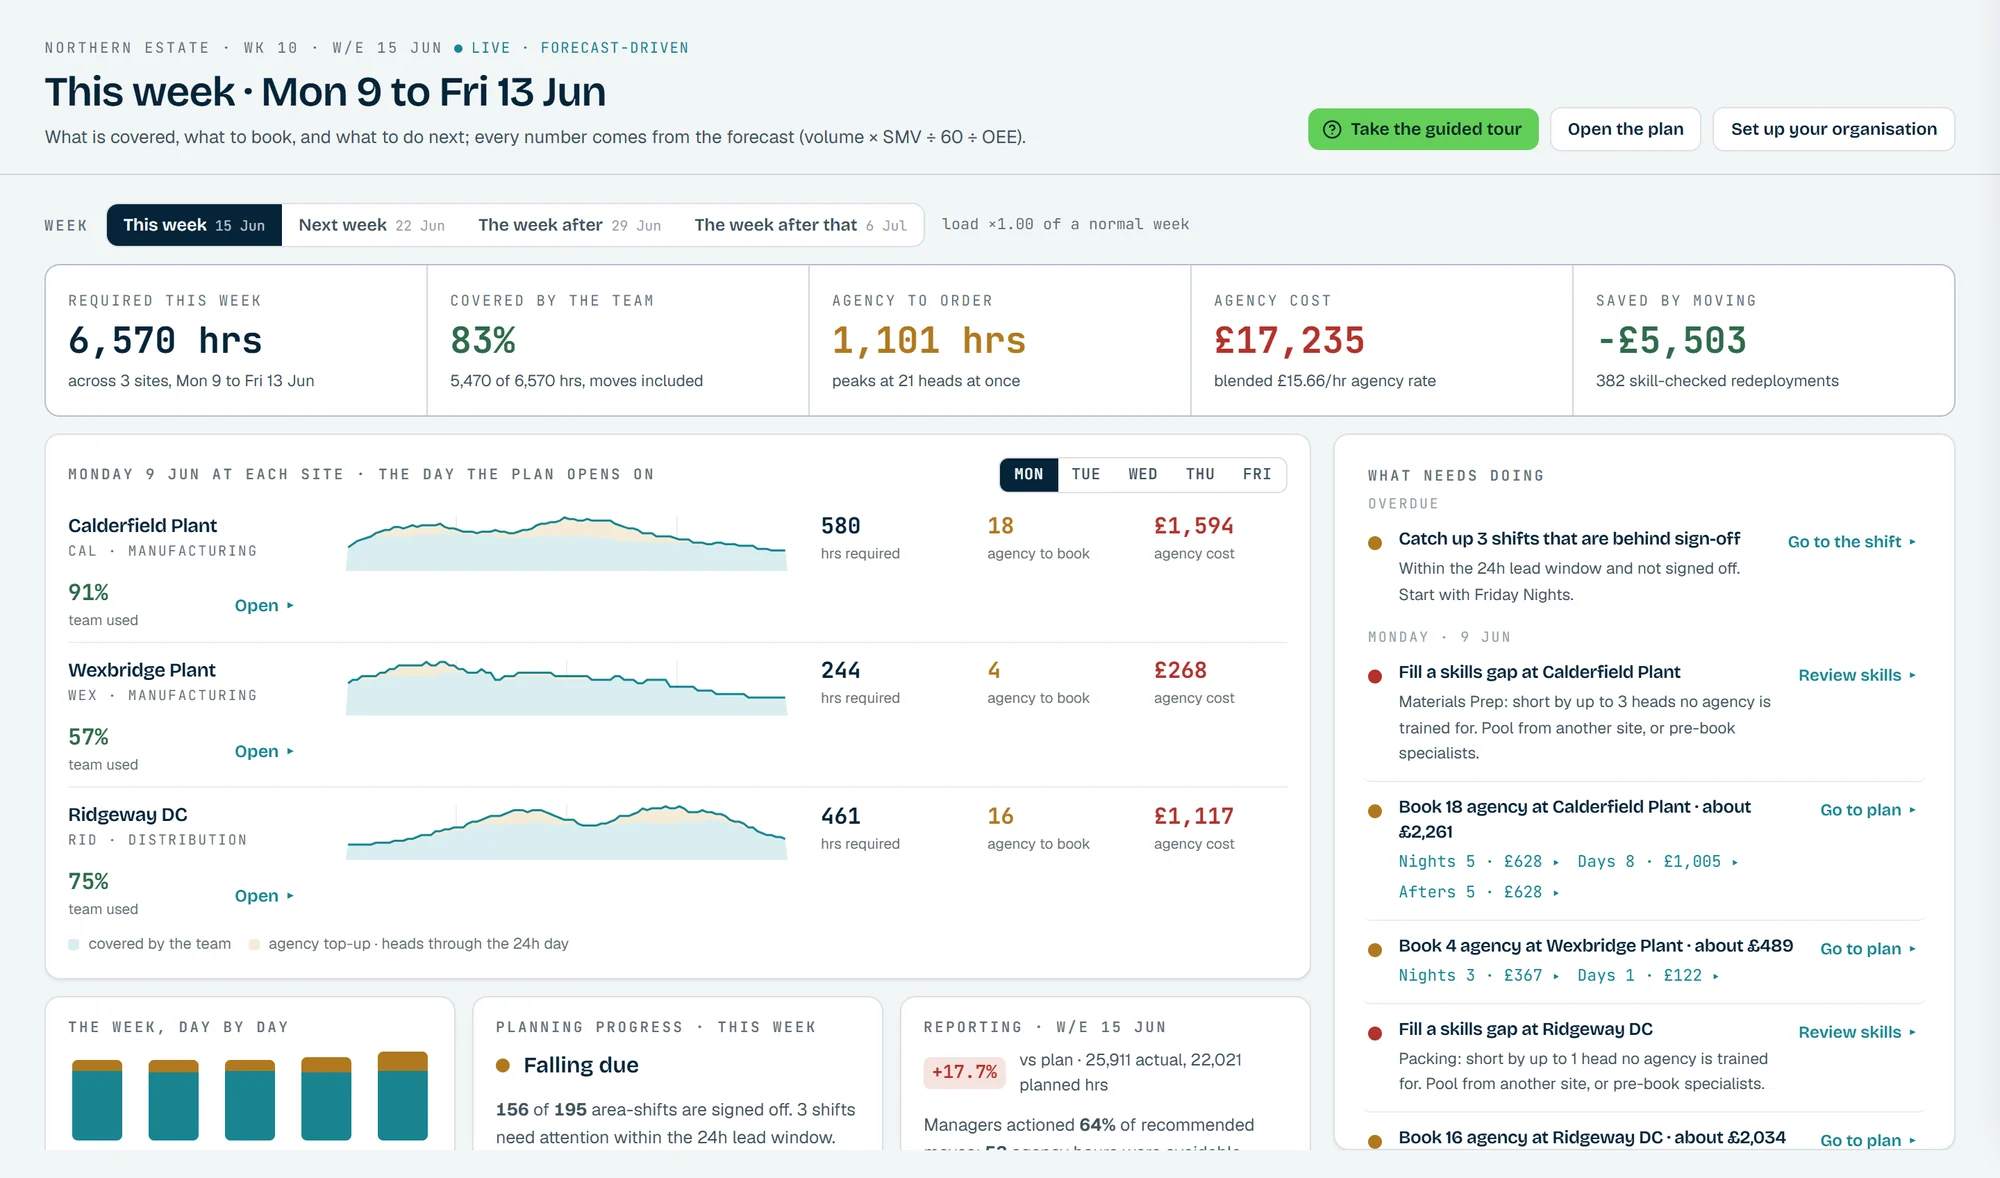
The week ahead
Hours required across every site, the share the team covers once moves are counted, and the agency to order.
What operations directors ask about the plan.
Can we see why it moved someone?
Will it move people into work they cannot do?
What data does it need?
Can it plan more than one site?
How does it reach our reporting?
See your own forecast as a labour plan.
Talk to Libra about turning your forecast, standards and skills matrix into the heads each hour needs and the agency you actually have to order.
Talk to Libra about Outlay Labour
Tell us how you plan labour today, and we will walk you through the product.